Desktop Map Experience in a Browser
When working with maps in a system like GIS user usually needs to create maps and see results fast. Most of desktop GIS engines do this quite good, but today we can see that there is great need of such experience in web browsers as well. GIS Cloud with it’s mission of moving GIS from desktop to web through a cloud environment focuses on visualizing maps faster.
Most of the web mapping technologies out there are raster based e.g. Google Maps. Those maps consists of many map tiles (images) usually ordered in pyramidal scheme. Such tiles are being loaded in maps quite fast and that is because they are already rendered on servers. There are also open source engines like Mapnik that can do the same out of any geospatial data. That engine in combination with TileCache software can produce raster map tiles out of any data, but there is one big problem: rendering in realtime.
Creating raster imagery can be CPU and memory consuming. In many cases tiles are being rendered in advance and then just streamed from a server. That can work for deploying projects, but not for realtime rendering which is needed when we have a dynamic GIS map that we want to create and edit in a browser.
Vector Map Engine
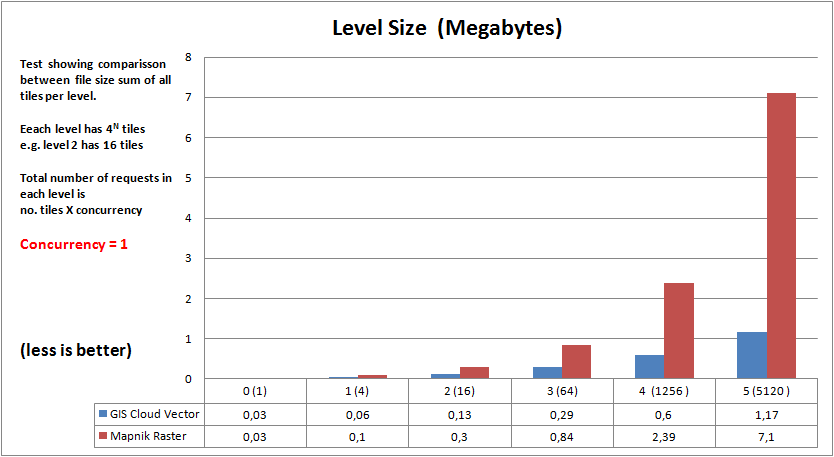
GIS Cloud, beside being able to produce raster map tiles, is able to produce vector tiles as well. Those tiles are rendering quickly and they are only 20%-50% in file size when comparing to equivalent raster tiles. This can happen because tiles are not rendered on server they are actually packed into a vector format and delivered to the client where rendering actually happens. GIS Cloud can produce vector tiles in SWF and SVG format. SWF format is Adobe Flash format which then that engine renders with great performance. The SVG format is still being test, but this format is the vector format for HTML5 and future web standards for rich media content.
In this article we will make a comparison of real time rendering of raster and vector map tiles. For the test we used a map of world in Shapefile format which has size of around 45MB and consists of 27,000 features.
Benchmarking Method
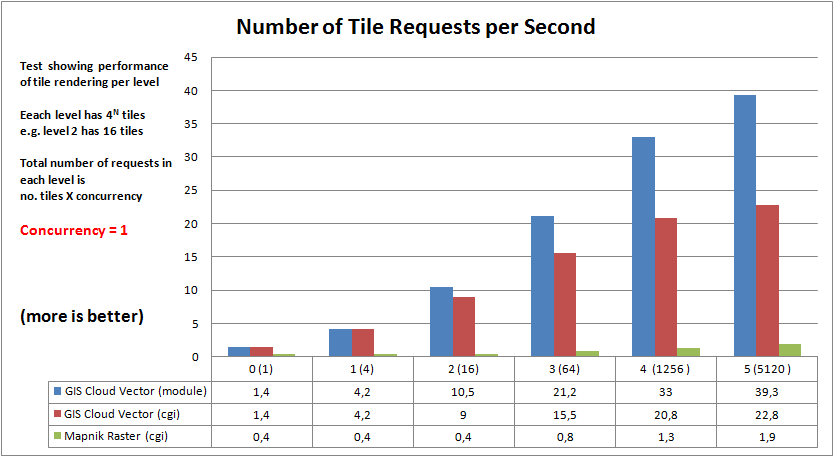
We tested and measured tile generation on various zoom levels usually from level 0 to 5. Each of those levels has 4^N number of different tiles where N is number of level. So levels 0 has 1 tile, level 1 4 tiles, level 2 16 tiles, level 3, 256 tiles, etc.
Cache for both methods was turned off. Each request did real work so that we can compare realtime performance.
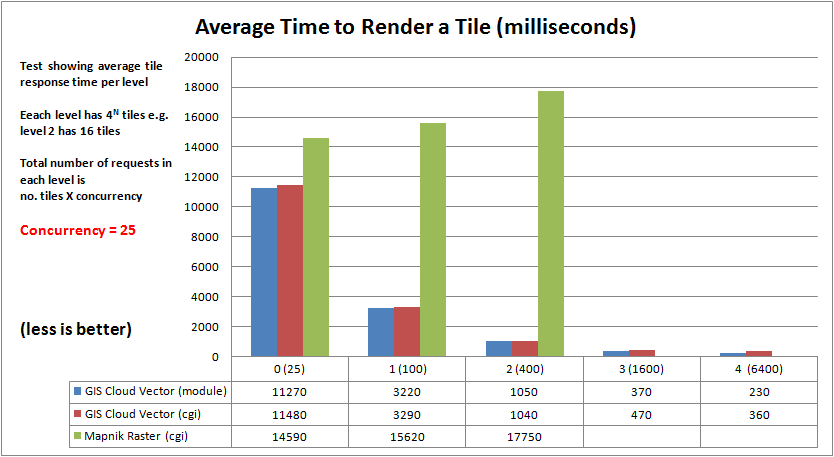
We also tested at different concurrency levels i.e. at 1, 5 and 25 concurrent processes. Total number of requests is multiplied by concurrency, so at level 2 with concurrency 5 there were 4^2 x 5 i.e. 80 requests.
The test server was 2.5 GHz quad core CPU, 4GB of memory and 15k disks in RAID1.
Mapnik i.e. TileCache was tested as CGI and GIS Cloud vector engine as CGI and Apache module.
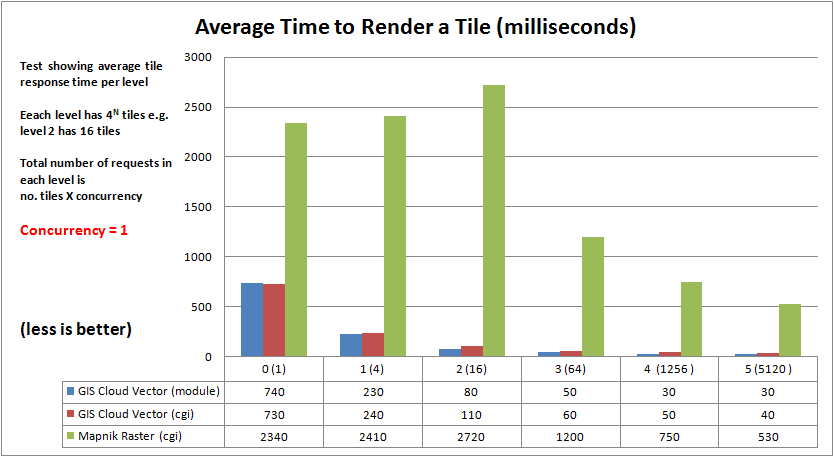
First we tested with only 1 concurrent process:
5 concurrent processes:
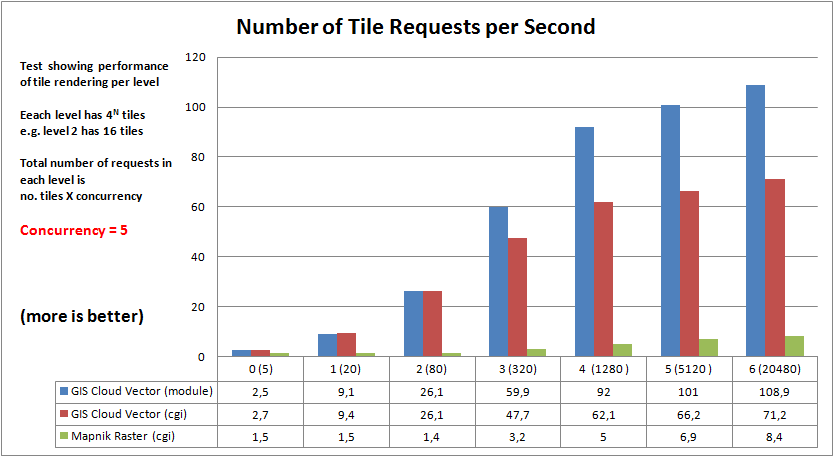
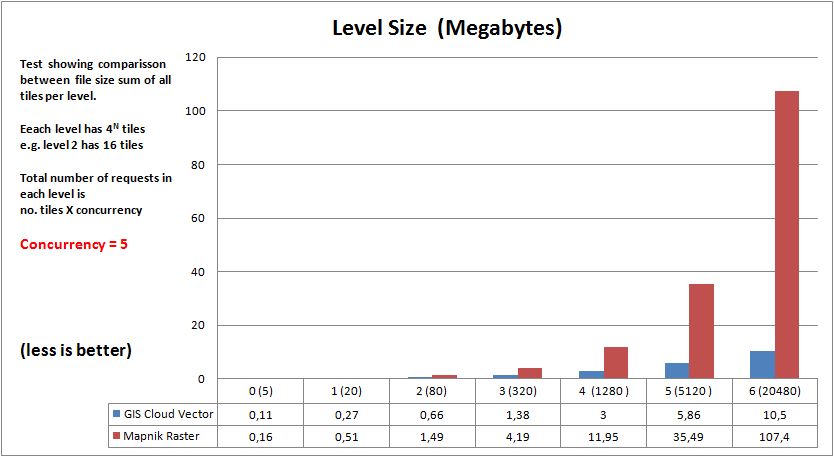
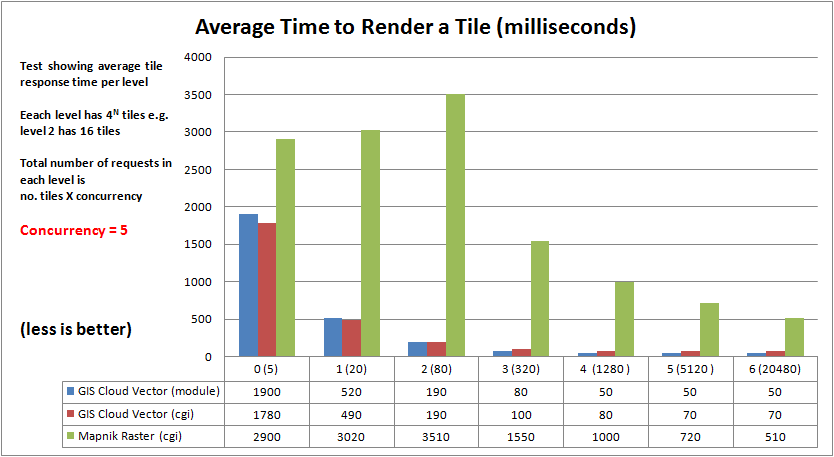
25 concurrent processes:
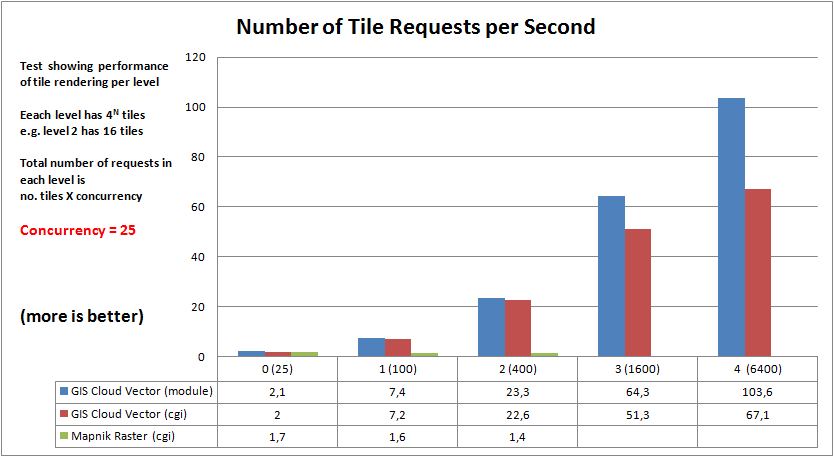
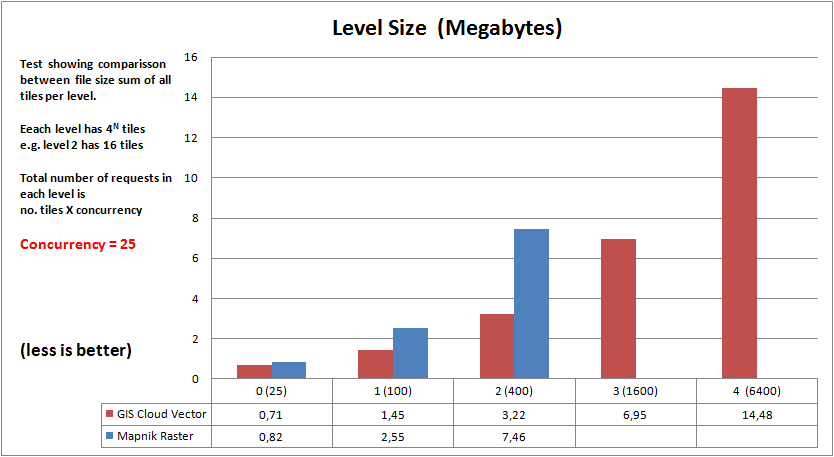
Conclusion
From this benchmark we can notice significant difference between resources needed to produce vector and raster tiles. Not only that with vector technology it is possible to produce more tiles per second, the size of those tiles is significantly lower and therefore less bandwidth is needed. Vector GIS technology that provides such performance can enable true desktop GIS experience in a browser and open up possibilities for having more and more GIS tools on the web.
Interested in trying the GIS Cloud platform? Subscribe for a 30 day free trial.


