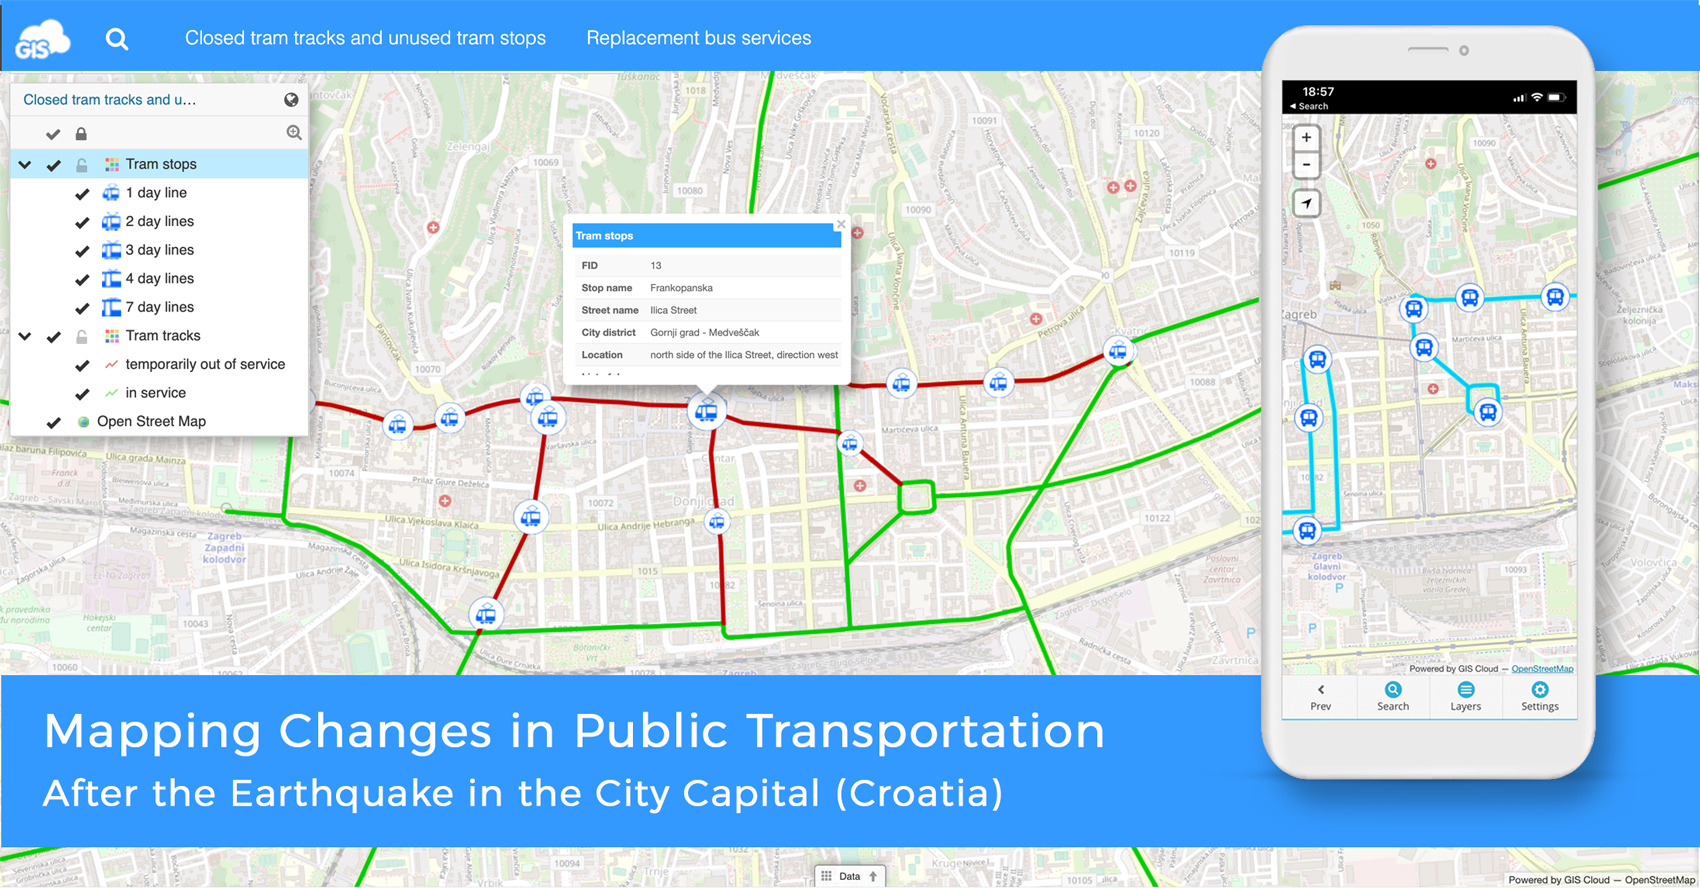
Martin Malović, Geography/GIS student at the University of Zagreb, Faculty of Science made an interactive Map Portal with the help of GIS Cloud apps, representing changes in public transportation due to earthquake damages to facilitate daily movements for people in the city.
Maps that are created as a part of this project show the Zagreb city center tram network that was temporarily out of service due to earthquake damage. Because of this unfortunate event, ZET (Zagreb Electric Tram) needed to replace these tram routes with standard bus lines.
The main goal of this project was to create maps that will make planning and travelling with public transportation in the center of Zagreb much easier to the public.
On 22 March 2020, an earthquake of magnitude 5,5 on Richter scale hit Croatian capital Zagreb. The earthquake caused severe damage to the historic city center. That same day all public transport in Zagreb was temporarily suspended.
After the gradual reopening of the public transport system in late April and early May 2020, parts of the ZET – tram system in the center was not operational because of the track and overhead wire damage.
In mid-June 2020, almost 3 months after the earthquake, ZET tram traffic in the center was still out of order which stimulated Martin to do this noble project.
Project Outline:
- Setting Up Data Collection Projects and Collecting Data In The Field
- Creating a Custom GIS App To Represent Maps For The Public
- Results For Faster Routes Planning
Setting Up Data Collection Projects and Collecting Data in the Field
To collect the necessary data four different layers were created:
- tram tracks
- tram stops that are out of service
- replacement bus lines
- stops of the replacement bus lines
Generally, in GIS, tram tracks and bus lines are shown as lines, while tram and bus stops are shown as points. For this purpose, 4 different projects were created in the Mobile Data Collection Portal. For each project, it was necessary to define data type (point, line or polygon) and attributes that describe individual elements. Number and type of attributes can be changed at any time later.
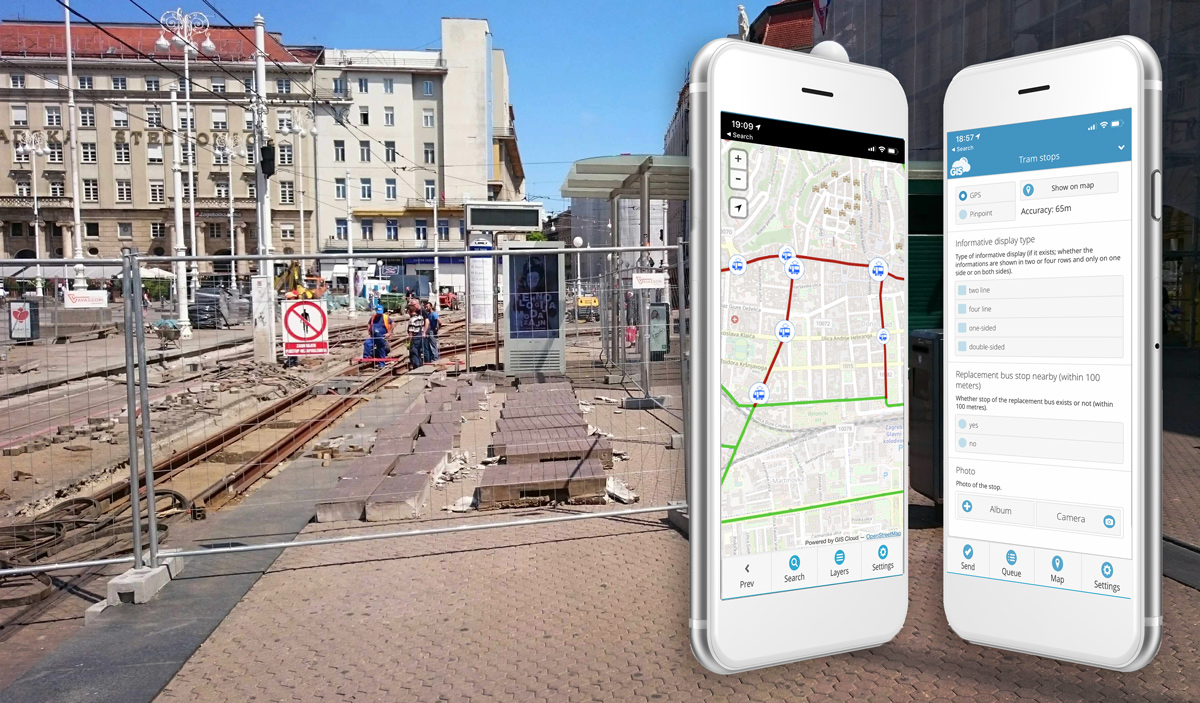
Next step was collecting field data with a smartphone. It was necessary to go to all of the closed tram stops and replace them with alternative routes via bus stops. At each stop, geo-location was added by filling in the form regarding a specific stop using the Mobile Data Collection app and sending the right location via the smartphone GPS.
Other attributes that were collected for each stop were:
- stop name
- street name
- type of stop
- lines passing through stop
- existence of benches, shelters and informative displays
- photos of stops

These attributes can be edited later in the Map Editor, a connected web app for uploading data, creating maps and data sharing. Martin took photos of each stop and track segments and added them as one of the attributes in the project. According to locations of stops and the basemap, Martin added geo-locations of line elements later in Map Editor. He also edited attributes of all four layers later in the Map Editor.
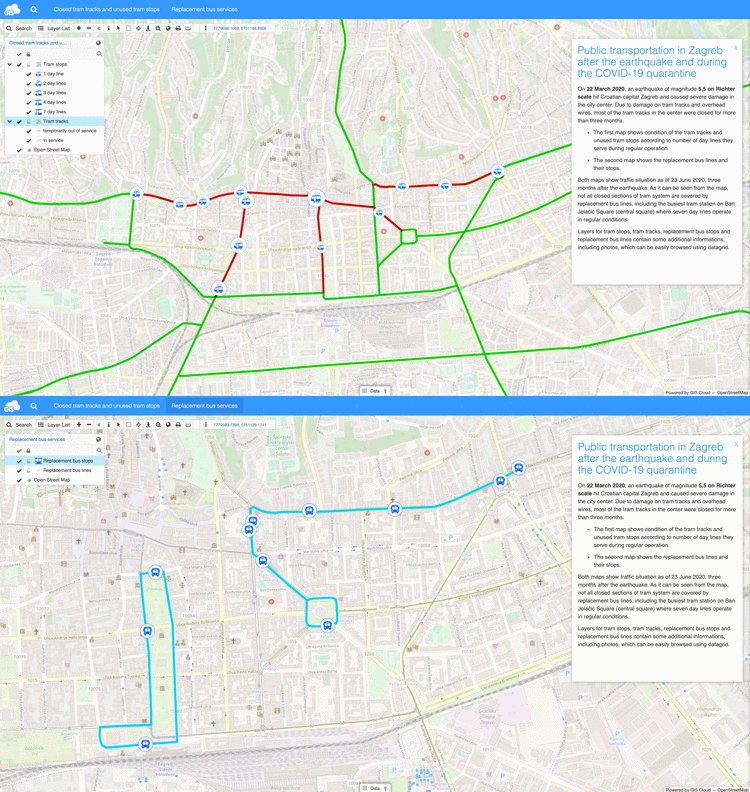
From the collected data, Martin created two different maps:
- First contains layers of tram stops and tram tracks
- Second contains layers of bus stops and bus lines.
Creating a Custom GIS App to Represent Maps for the Public
In order to make all collected data publicly available, Martin used GIS Cloud App Builder to create his Map Portal. This GIS app that you can create in one afternoon, allowed him to display several maps at once and easily switch between them.
The first map in the Map Portal contains layers of tram stops and tram tracks, and the second map contains layers of bus stops and bus lines. As mentioned, two different maps were previously created in Map Editor by adding two layers that contain tram tracks and tram stops to the first map and two layers that contain bus lines and bus stops to the second map.
Attributes are presented on the map with different icons. You can review attributes for each layer using the datagrid, which you can open by pressing the button on the bottom of the map.

To browse Map Portal for public transportation, open this link.
Results of closed tracks in the city center showed that seven out of fifteen day tram lines changed their regular routes and operated on a different schedule (lines 1, 4, 6, 11, 12, 14, 17). One regular line(line 13) and all night lines were out of service as well.
Closed tram line sections include tracks in 6 streets in the city center:
- Ilica Street from Franjo Tuđman Square to Ban Jelačić Square
- Jurišićeva Street from Ban Jelačić Square to Draškovićeva Street
- Vlaška Street from Draškovićeva Street to Eugen Kvaternik Square
- Franjo Rački Street between Draškovićeva Street and Square of the Victims of Fascism
- Savska Street and Frankopanska Street between Ilica Street and Vodnikova Street between Ban Jelačić Square and Main Railway Station
Also, a short track on Eugen Kvaternik Square, loop for the tram line 13 was out of service.
In total, 5,2 kilometers of tram tracks were out of service which makes around 10 % of the entire tram network.
The busiest section of the entire system is in Ilica Street between Frankopanska Street and Ban Jelačić Square where seven day lines (1, 6, 11, 12, 13, 14, 17) operate in regular conditions. The busiest stops are still located on Ban Jelačić Square (central square).
Fortunately for the public transport users, replacement bus lines were introduced:
- line 608 connected Eugen Kvaternik Square and Square of the Victims of Fascism, was replacing the tram traffic in Vlaška Street and Franjo Rački Street
- line 611 connected Main Railway Station and Nikola Zrinski Square, partly replacing tram traffic between Main Railway Station and Ban Jelačić Square
Tram tracks in Ilica Street, Jurišićeva street, Savska Street and Frankopanska Street, with a total length of 3 kilometers, were left without the bus line replacement and therefore without public transport at all.
Results for Faster Routes Planning
This was the biggest drawback of public transportation in Zagreb because the large part of the city center was left without any public transport. Some parts of the neighbourhoods were more than 1km away from the nearest public transport stop.
Bus terminals on the British Square and Kaptol where passengers from regular bus lines change to tram lines were left without the replacement bus service. This meant that the passengers needed to include their long walks into consideration in their travel schedule.
Consequences of the earthquake and changes in public transportation also increased travel time for the passengers in the wider area of Zagreb city center. This happened because all tram lines had to bypass Ban Jelačić square using a southern route that passes near the Main railway station instead of a direct route through Ilica, Jurišićeva and Vlaška street.
Thanks to the Map Portal Martin created using the data he collected on the changes in public transportation, citizens are now able to find what tram, bus lines and stations are operational so they can plan their routes in advance and save time on public transport travel.
Interested in collecting data in the field or creating your own custom GIS app? Contact us.


