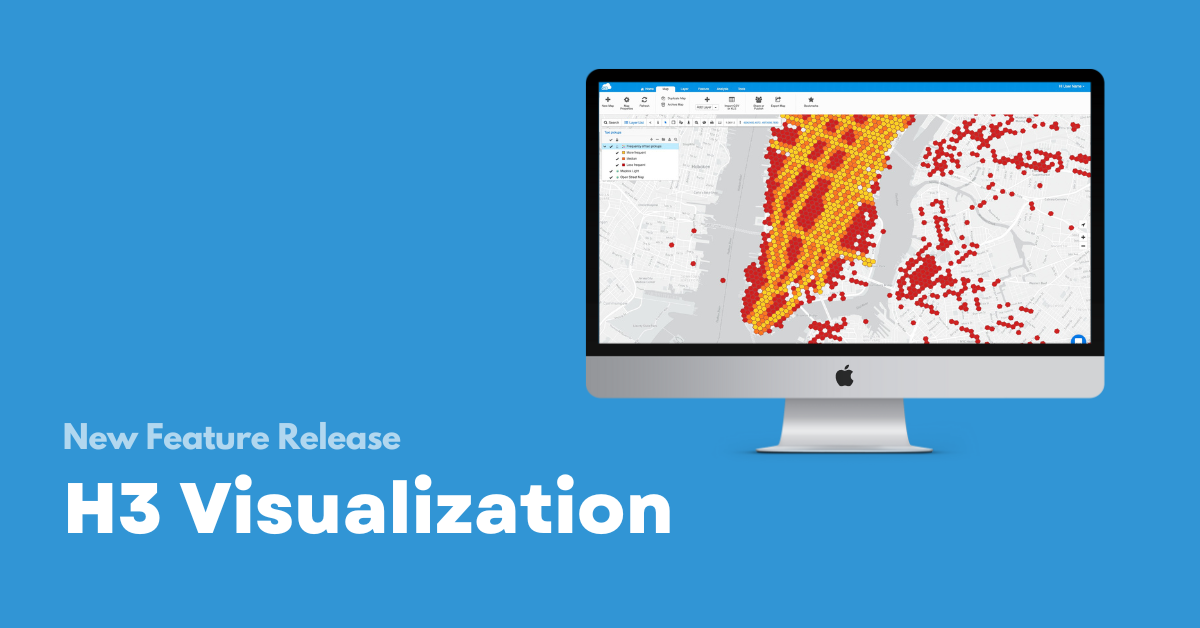
We are happy to announce that we have made some improvements when it comes to importing your csv/xls files to GIS Cloud. Until now, you have been able to upload only based on Lat/Long coordinate fields, and now we have brought you H3 and Well-Known-Text.
H3
If you have ever seen hexagon grids on maps, you probably asked yourself why?
When it comes to data visualization, as we have already mentioned, it’s always important to consider your main goal and what you and the end-user will do with that information. Regular shapes such as squares, triangles, and hexagons are a common choice for representing spatial data in a vector format, primarily for thematic maps, as they allow you to divide the space into equal subdivisions.
Hexagons are a great fit when dealing with large areas and even larger data sets – they provide better visualization because they nest together perfectly and their uniformity makes them a good choice for presenting thematic maps. At the same time, they enable you to understand your data more effectively.
There are quite more benefits of using hexagons when visualizing your data, but we believe that you will try and test that out for yourself.
Well-Known-Text
For the representation of vector geometry objects until now, you have been able to work only with point data. With WKT you are now able to visualize not only points but lines and polygons as well. So if you are working with that type of data, feel free to give it a try.
Check out our quick video and learn how to make your first H3 map now:
For a step-by-step guide, make sure to visit our manual HERE.
As always, we would be happy to hear from you, so feel free to send us an email at info@giscloud.com, and we can help you with data visualization in your projects as well.
In the meantime, try some data visualization options yourself by signing in, or if you already haven’t, create your account and start using GIS Cloud today.
Give us some information about your work and get a personalized demo.
Oops! Something went wrong while submitting the form.

H3 Visualization Spotlight
2 min read
Products
How it Works
Mobile Data Collection
Map Editor
Map Viewer
Map Portal
Crowdsourcing
Publisher for QGIS
Publisher for ArcMap
Geocoder
Terms of use & Privacy policy © GIS Cloud Ltd


