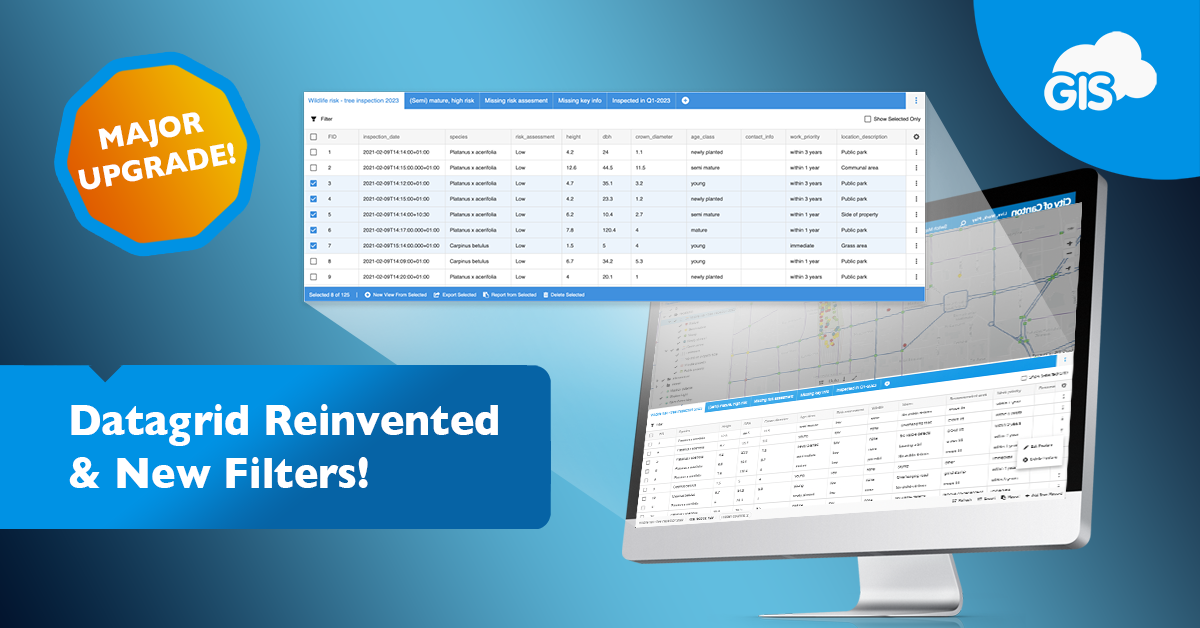
This is HUGE. You’ve been waiting for this. It will change how you work with Data.
We are so excited to share that a major release is out – a new Datagrid! It comes packed with powerful filters, including date range and other queries, neat table view customizations to help you easily analyze and consume data, report options, and much more.
In GIS software, along with the map, the datagrid (or the attribute table) is a fundamental part of your toolbox. It lets you view data from your map layer in a table format and helps you organize and navigate it. You don’t always have the option to display all the information visually on the map, so it’s essential to have a way to quickly access all the attribute values associated with geographic features represented on the map.
The new version of GIS Cloud Datagrid enables you to manage your data on a whole new level. It empowers you to explore, understand, and leverage the information hidden in your dataset.
So what’s new?
Take advantage of powerful New Filters
No more scrolling through the endless rows of data, checking for dates and inspection statuses! The new filtering options allow you to quickly search through your datasets and define which data is displayed on the map and in the data table according to your query or a combination of multiple queries (filters).
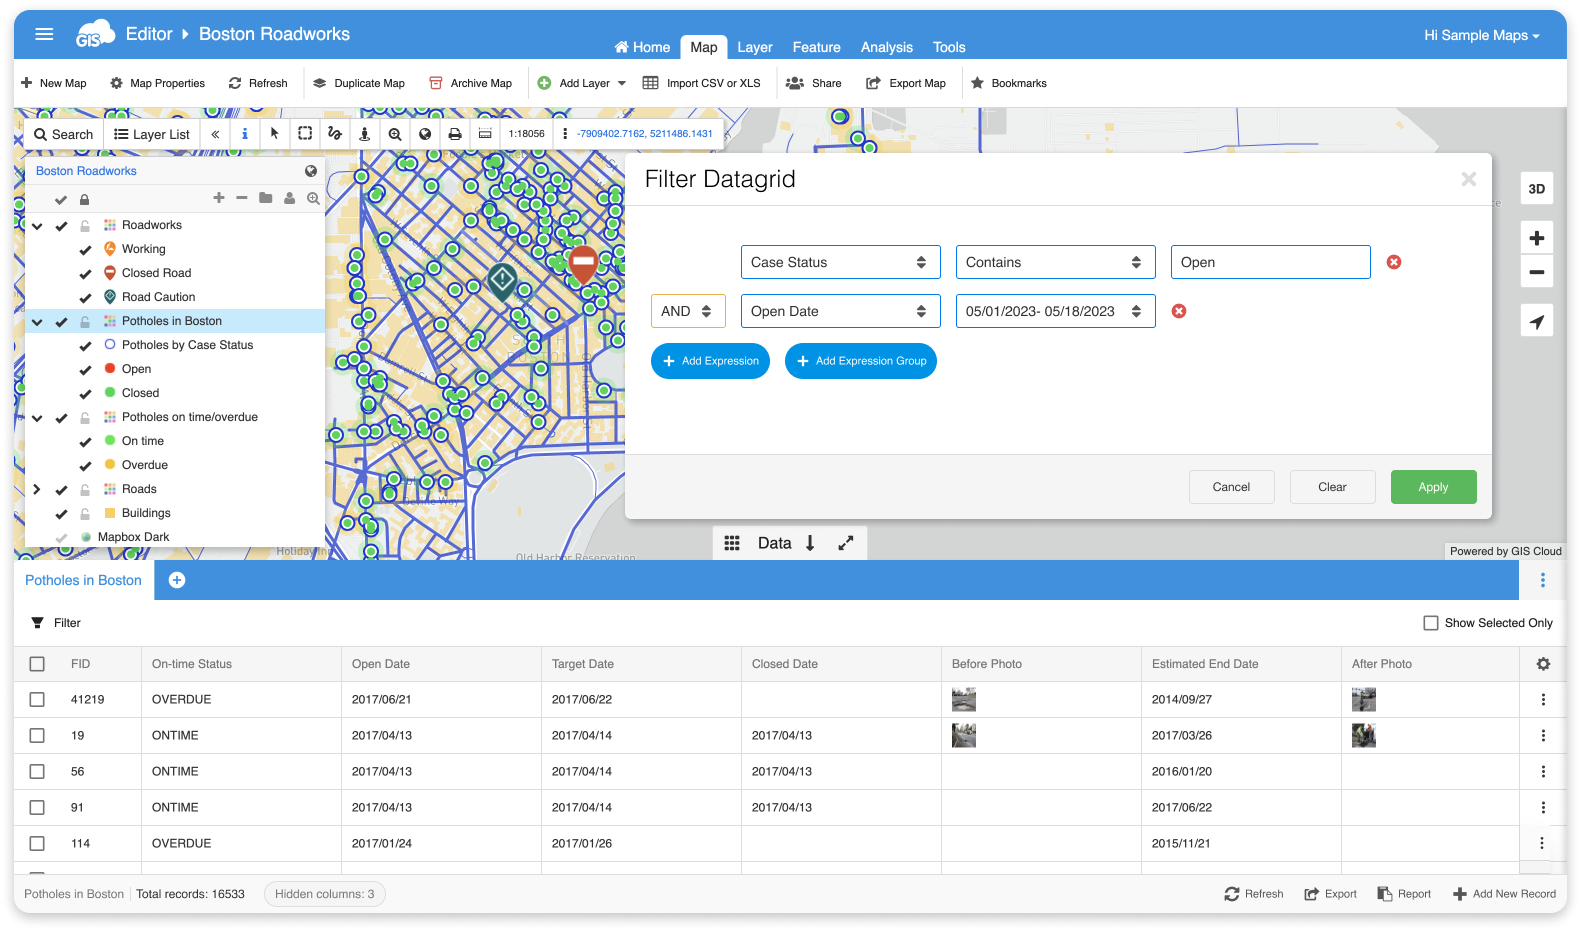
More sophisticated filters allow combining different attribute values you want to include in your results. Just add another expression (query) utilizing the AND and OR operators to narrow down your results further and quickly find what you are looking for
You can also filter based on time more efficiently, using predefined choices or by setting up a custom timeframe.
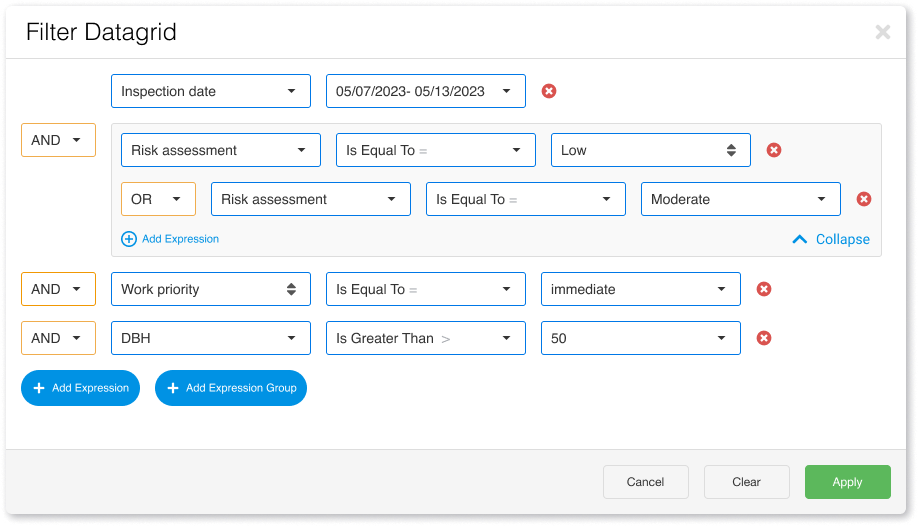
Filter now use autocomplete for faster workflow, and you don’t have to worry about using caps lock or not. The new filter is not case-sensitive and works smoothly with different inputs.
Save your filtered data as Custom Views!
Boost your workflow tremendously by creating and saving custom data views according to filtered results!
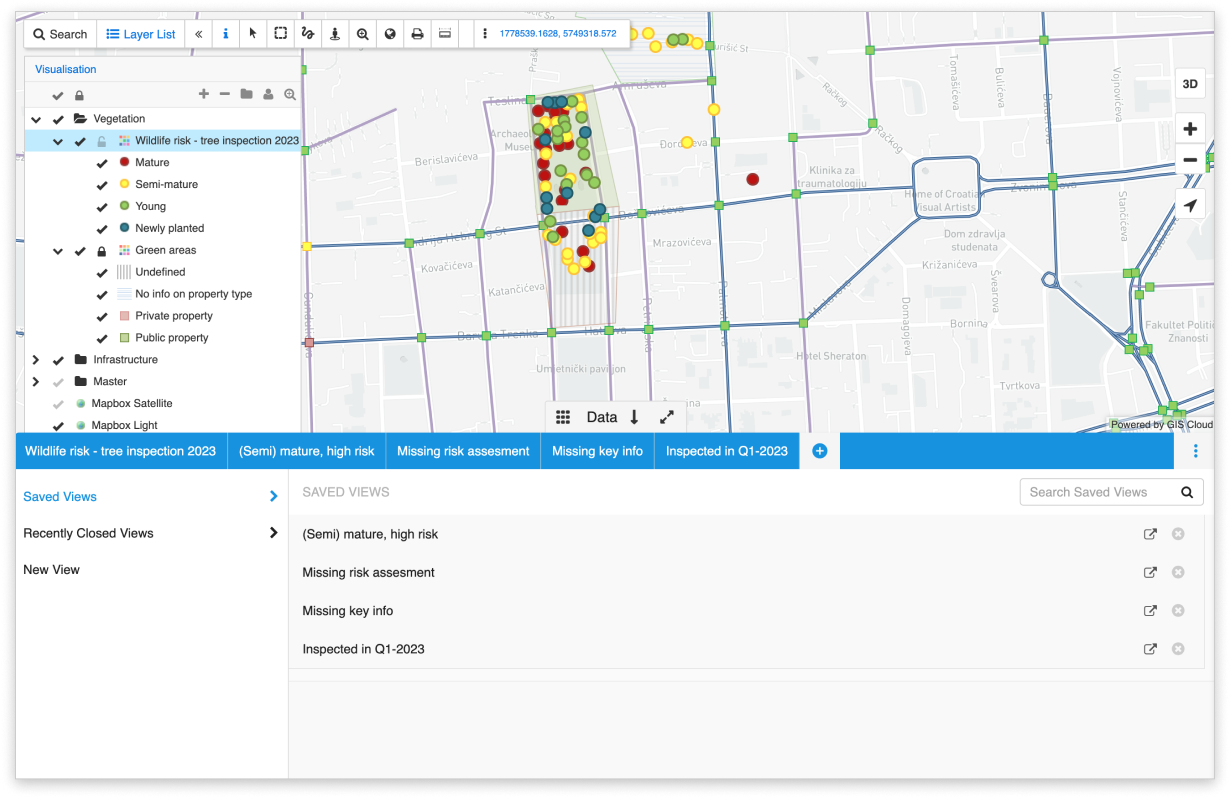
Once you have filtered your data using desired conditions, save your results as a custom view. There are many possibilities to filter data, and you can save as many custom Views as you want>. You can also select specific data records in the table, turn on the “Show only selected” option, and save this as a new View.

What is even better, you can open multiple saved Views in different tabs and easily switch between results for quicker insights!
Your saved Views will be visible to other users with access to your layers, so you can easily collaborate and better understand the data you’re working with. Saved Views will also change what’s visible on the map, so you don’t have to rely on the appearance settings alone.
Export and Report data that match your filters
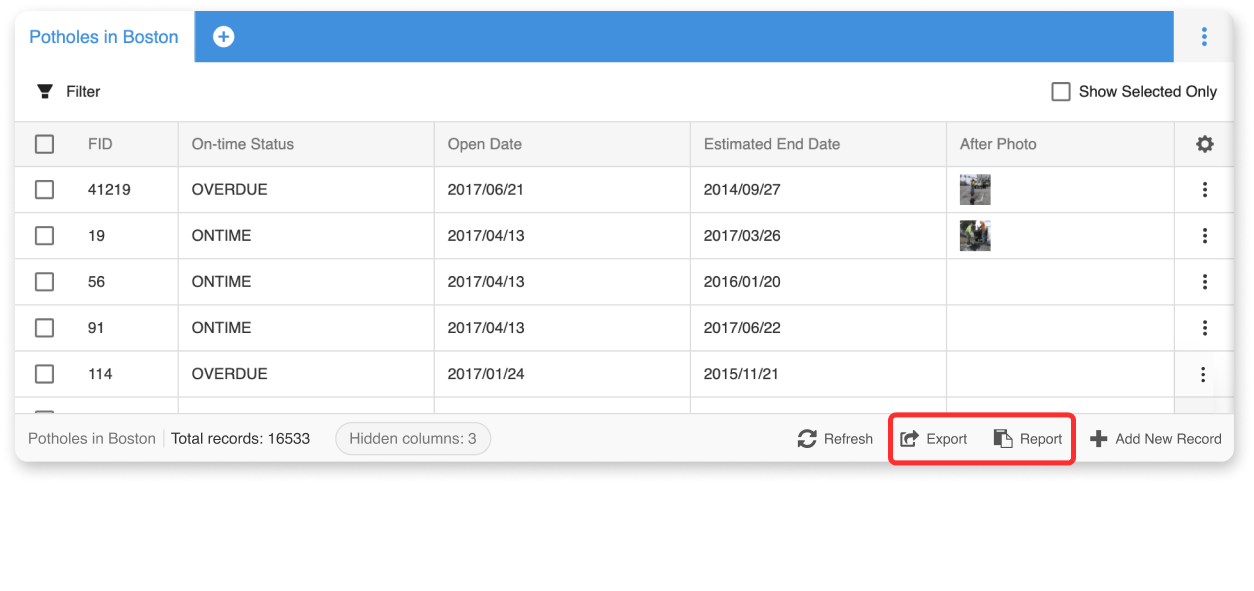
After you have filtered your data, you can easily Export or Report the entire View – the part of your dataset that precisely matches the filters you set up.
Also, you can select only several features in the table and Export or Report only those records.
Data Table Customizations
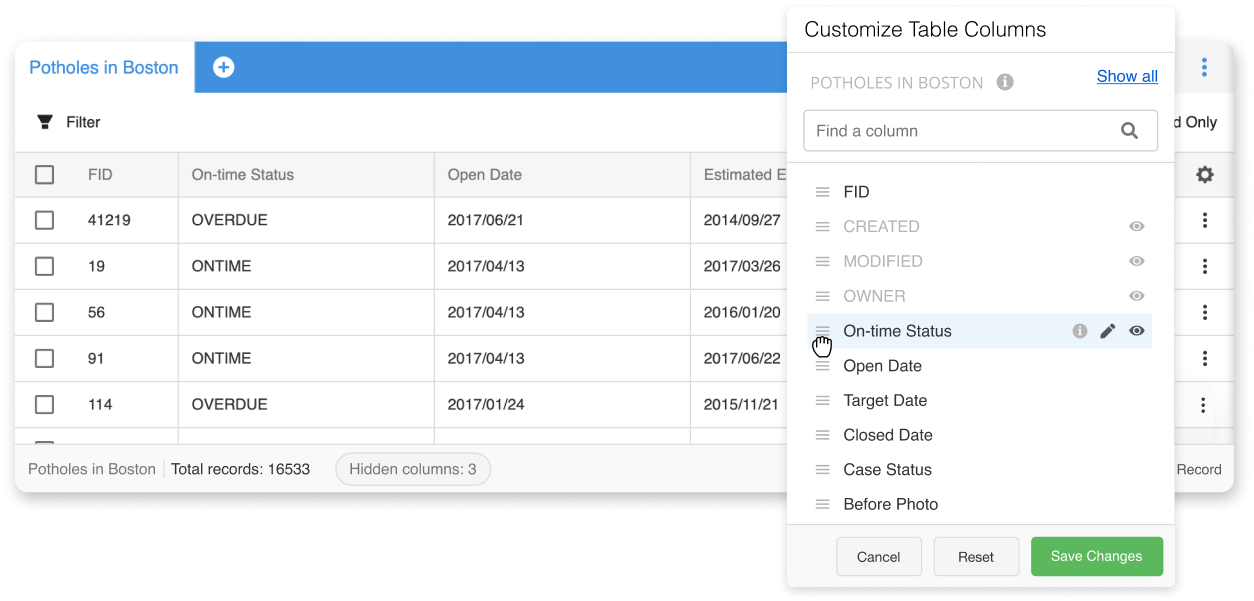
The new Datagrid now includes a Settings option to quickly find specific data attributes and decide whether this column should be visible or hidden in your table.
This customization will help you cut down the noise and display only relevant data for your current assignments or decisions you have to make.
Give the new filters a try, and for more information, read the detailed guide here.
Don’t have an account? No problem – start here! As always, we look forward to your thoughts on our newest features, so email us at info@giscloud.com.


