Tracking changes over time has become a necessity in various fields in environmental management. By keeping track of data records, different patterns can be distinguished which can be relevant for decision making.
For instance by displaying annual data for fire activity on a map, patterns can be observed as to which locations are more distressed, which land use type and areas of protection fires attain. By adding this spatial component to your data, different types of analysis can be made that will improve your decision making process.

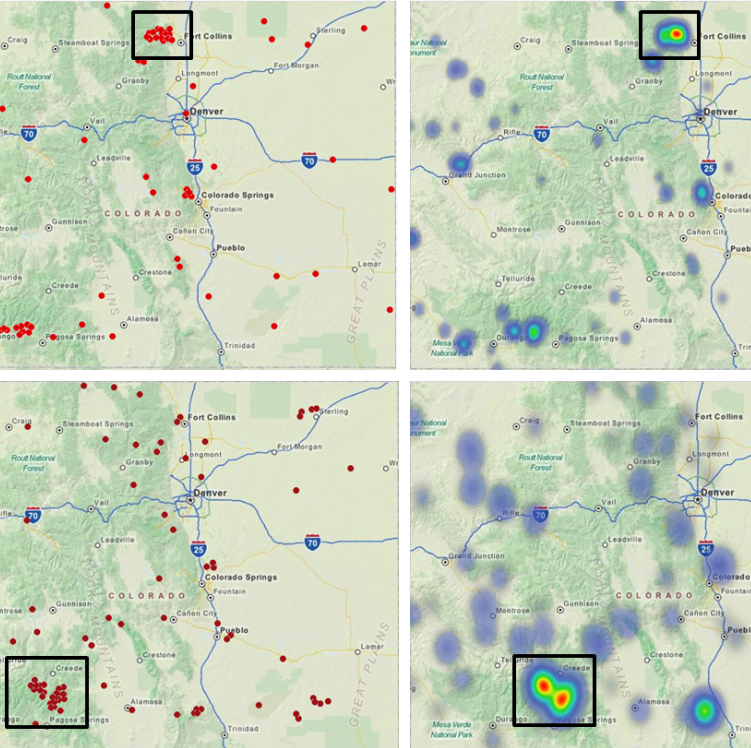
Heatmap results of fire activity in 2 given years showing different hotspots (2012 on the left and 2013 on the right)
Challenges:
In order to put the data to best possible use and get the most effective results, different aspects of collaboration between various departments like Agriculture, Water, Traffic etc. need to be considered. Working together in real time, from different locations like office and field becomes a much needed workflow. Once the results are ready, there is the need to share them in and outside the organization with GIS and non-GIS experts.
- Work together with departments specified for different areas to answer questions like:
– which locations are distressed
– which land type and areas of protection do fires attain
– which administration units are assigned to which areas - Manage levels of access and permissions that allow different stages of collaboration
- Possibility of a multi user simultaneous work environment from different locations
- Collect new data from the field with the possibility of instant update
- Implement existing data to ongoing projects in various formats
- Share your results, maps and data with users outside your organization through a user friendly interface (for non-GIS experts as well)

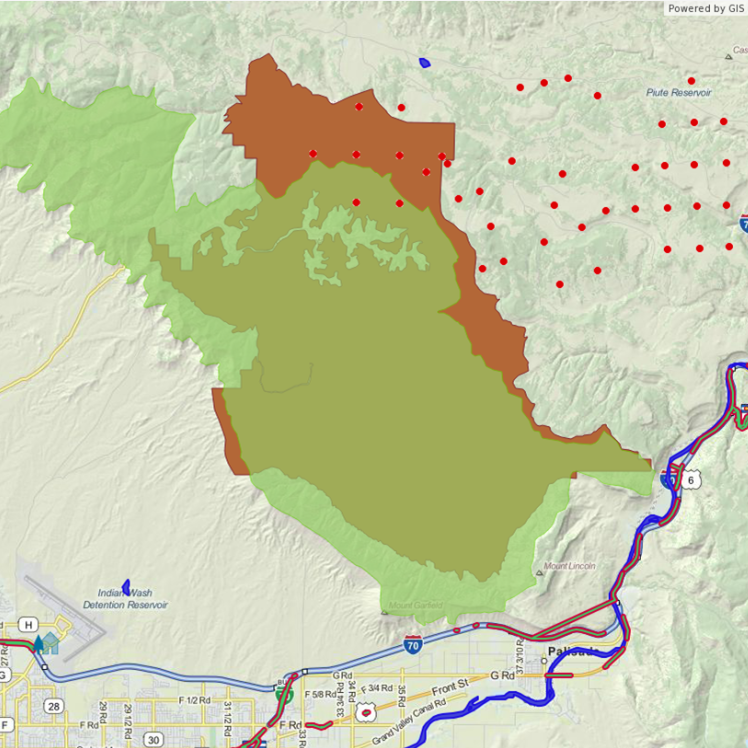
Zoomed in hot spot area from 2012, showing different types of environmental data overlaid with fire activity data
Solution:
GIS Cloud apps enable you to take the collaborating approach a step further. With its permissions and Manager app, you can now administer the entire collaborating and sharing process to the fullest. By adding spatial component to your data, different types of analysis can be made such as heat map analysis and overlay which will show hotspots of high-risk areas.
Heat map analysis can be done in Map Editor on any point data you have or that you collect in the field by using Mobile Data Collection. You can have multiple coworkers working on maps and data at the same time while having different permissions like view/edit/export or even collect/update for data collection. With Map Viewer you can share your maps with users that are even outside your organization, through an intuitive user interface.
Results:
- Set of collaborative tools and permissions for data editing and updating applicable for using in and out of the organization
- Management tools for different levels of access throughout your organization and different departments
- Sharing tools for visualization of results, intuitive, easy to use and in real time
- Tools for using the existing projects and data, one click plug-in for ArcGIS for Desktop


