GIS is a powerful tool being used worldwide. Maps have become an effective tool for communicating information to people.
In recent years, maps have been frequently used to show the widespread pandemic and the impacts of natural disasters. Maps and GIS communicate with minimal losses in translation about what is happening, where it is occurring or where it may spread to, and when things may occur.
Amazing maps that meet these criteria can be produced with cloud-based GIS solutions like GIS Cloud.
What is GIS?
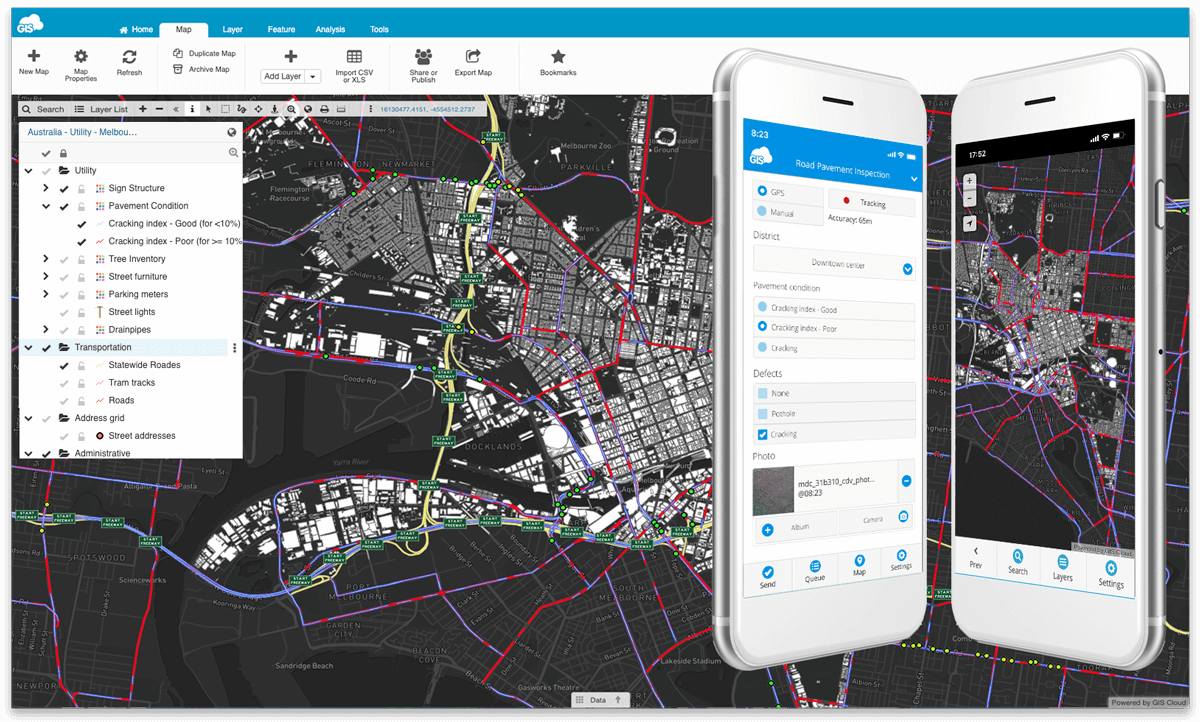
GIS is a collection of systems that collect, manage, analyze, and present spatial information. Using a combination of hardware, such as your smartphone and computer, as well as software, like GIS Cloud, information in the real world can be digitized and evaluated.
GIS helps identify patterns and relationships in complex data. This information is used for decision-making and communication with those affected.
This process leads to the enlightenment of an object in the real world. A road in GIS is more than just a feature transporting people in vehicles.
Investigating a roadway in GIS shows you how much ground has become impassable to rainfall. Zooming out further, we can see the road’s role in connecting people in the community. Often public utilities are installed under roadways.
Thankfully, GIS can simplify these complex networks and present the information in easy-to-understand visuals.
What is Power BI?
Power Business Intelligence (BI) is a powerful analytics tool developed by Microsoft. The cloud service or desktop software allows users to create dashboards from their data.
The platform can produce reports with data visuals in charts and tables. The tool can work with over 70 data sources, including CSV tables, SQL Server databases, XML, and JSON files.
With analytics and visual reports, we can answer the other important question of “Why?”.
Understanding the cause of an event allows decision-makers to react correctly to matters of great urgency.
For example, damaged or destroyed roads cutting off access to safety for residents may occur due to weather-related debris flows. We know what happened and where. Understanding why the event took place will allow the appropriate response in handling the present situation and develop strategies for preventing similar crises in the future.
The reason may be the lack of vegetation on the adjacent hillside following a recent fire. Other causes could be the extreme slope of the hill itself or the lack of road barriers.
By knowing this information, tax money can be spent to prevent future devastation.
The vibrant dashboards produced within Power BI communicate to decision-makers the information needed to plan and spend tax money accordingly. InfraTrace shows us how they went about this when tasked to inventory the infrastructure of local towns.
Who is InfraTrace?
InfraTrace is a Swiss-based infrastructure management company. The company was founded in 1985 by Roland Christen and was a one-man show until the 1990s. In 1996, the company became an LLC and has continued growing ever since.
Sustainability is important to InfraTrace, so they took the initiative to find an environmentally responsible solution to repairing asphalt for their clients. Through their intensive research, they discovered Biochar.
Biochar is a carbon powder produced from biomass products like wood chips and agricultural waste. Biochar passively absorbs carbon monoxide from the atmosphere.
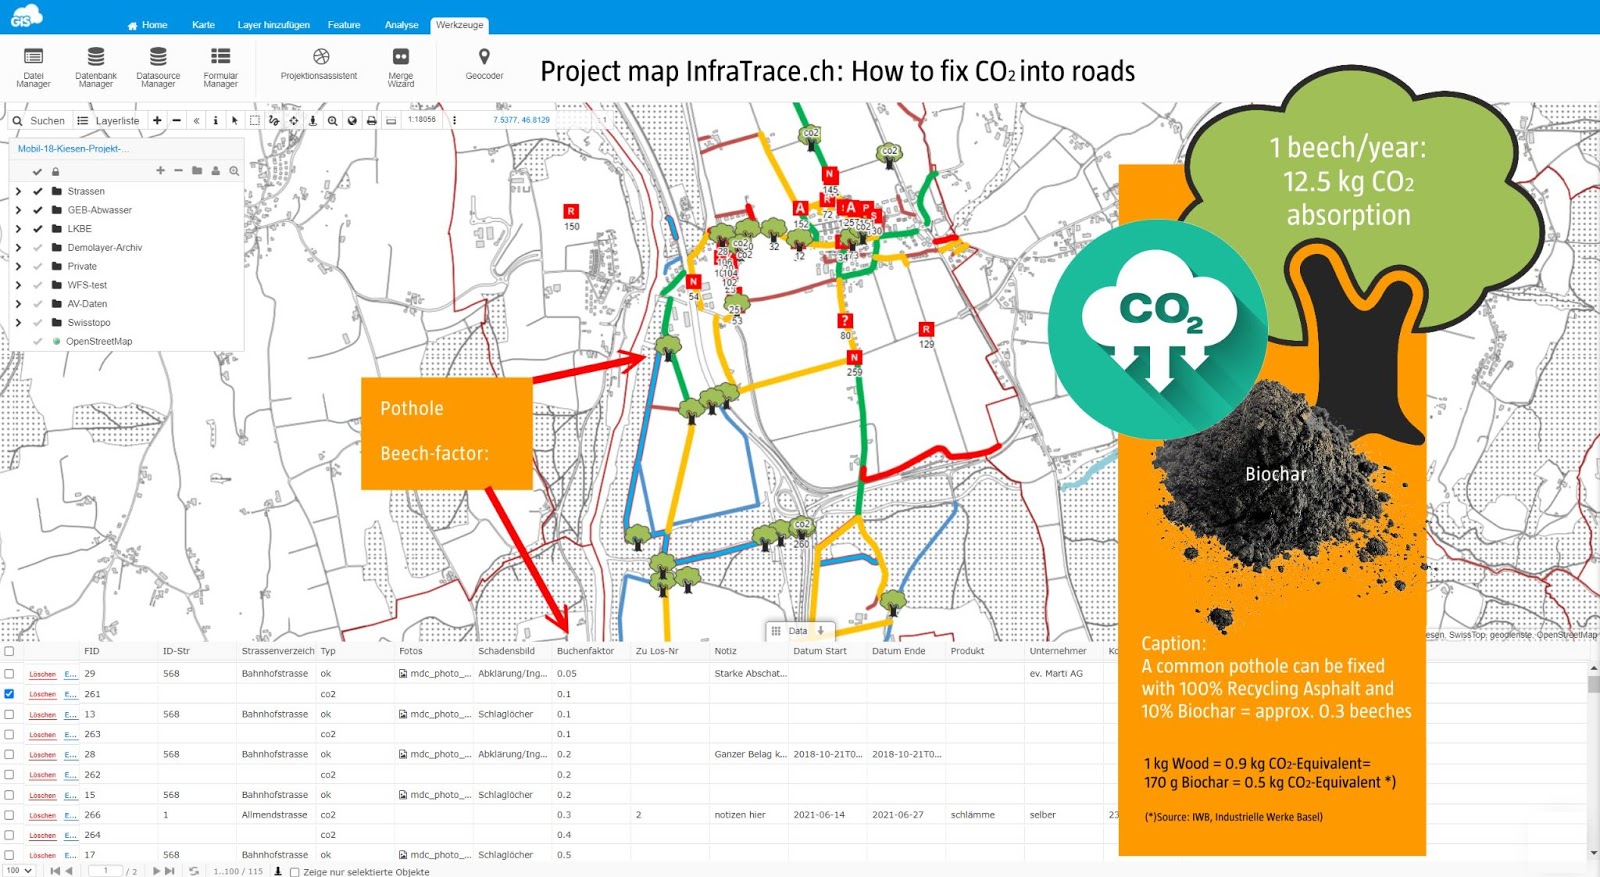
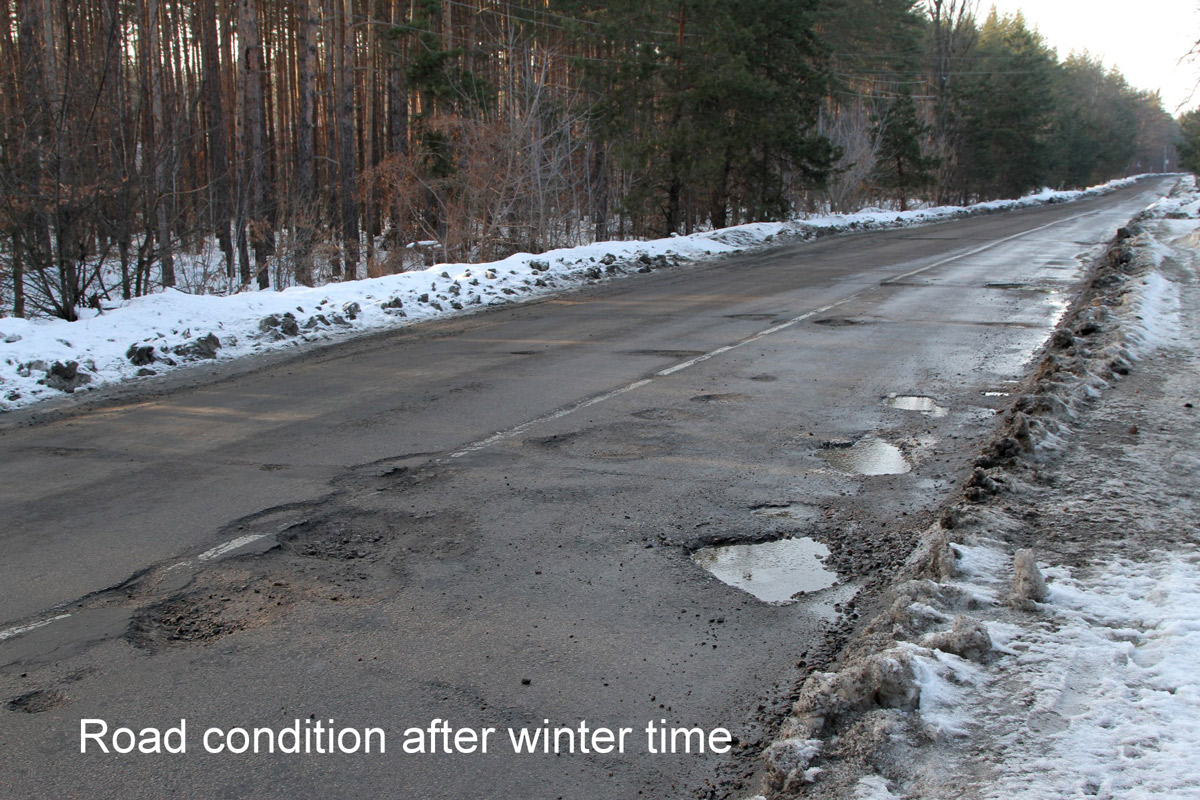
For the past few years, InfraTrace has been using Biochar to repair potholes and road damage. They call the combination of Biochar and 100% recycled asphalt InfraGreen. The process requires 8 times less energy and is easy to mold.
They have been using and tracking the locations since it was adopted in 2020 with great success.
InfraTrace focuses on supporting local communities and municipalities with their infrastructure maintenance needs. InfraTrace has developed a process of inventorying and analyzing a community’s infrastructure.
The process goes through planning, data collection, data modeling, publishing and analyzing the data using GIS Cloud solutions, and producing results in an InfraReport.
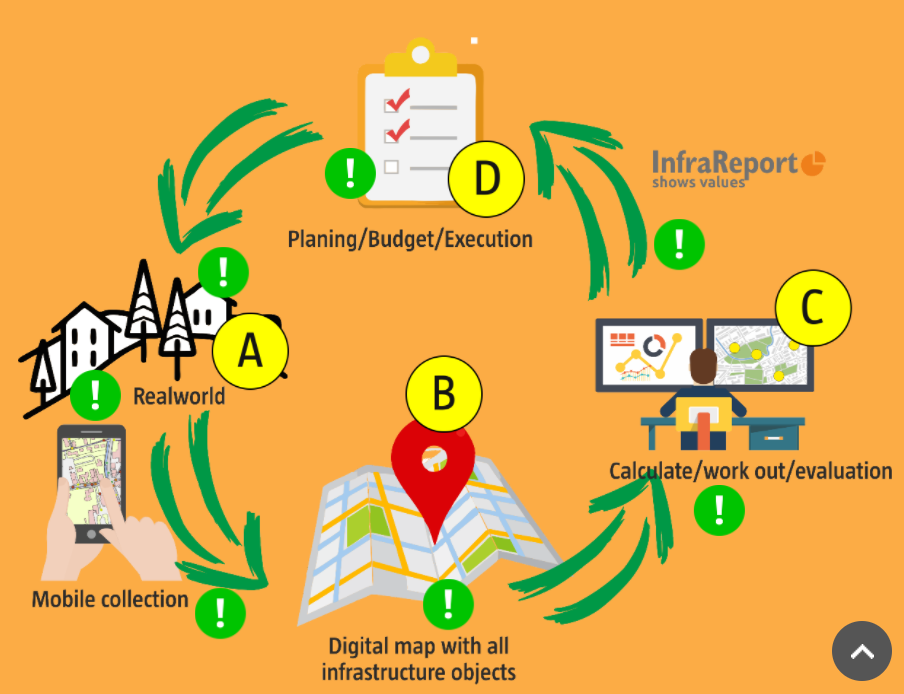
These InfraReports combine GIS Cloud and Power BI data and analysis for their clients to make informed decisions on the true status of their infrastructure.
Infrastructure Mapping
Using GIS Cloud’s Mobile Data Collection application, InfraTrace maps the infrastructure of their clients’ jurisdictions. The team collects road data, wastewater pipelines, freshwater pipeline systems, and other critical frameworks. The data collection process is done with Mobile Data Collection application and a GoPro camera installed into the InfraTrace vehicle.
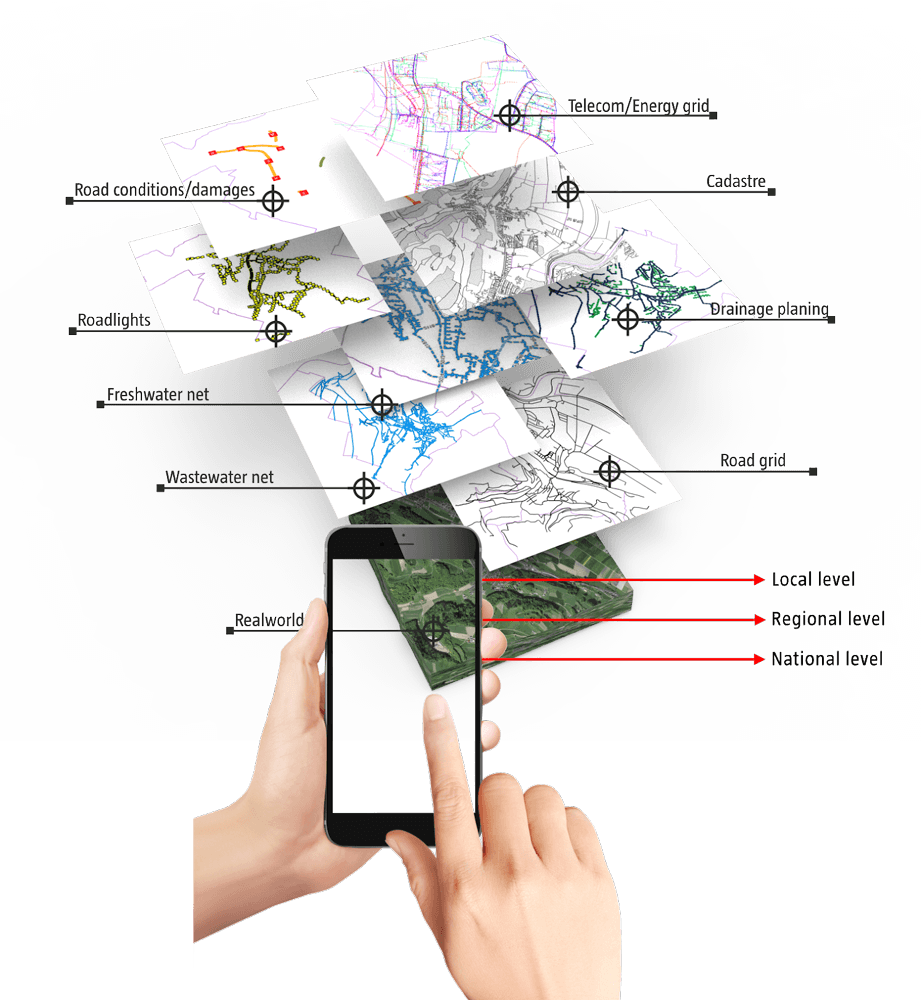
This process produces an accurate asset inventory of the physical features and locations while also including detailed attributes of the features. These attributes include the material, size, elevations, object’s physical condition, maintenance schedule, projected costs, and multiple photos attached in the Mobile Data Collection application. The videos collected with a GoPro camera are also linked to the project inventory in the office.
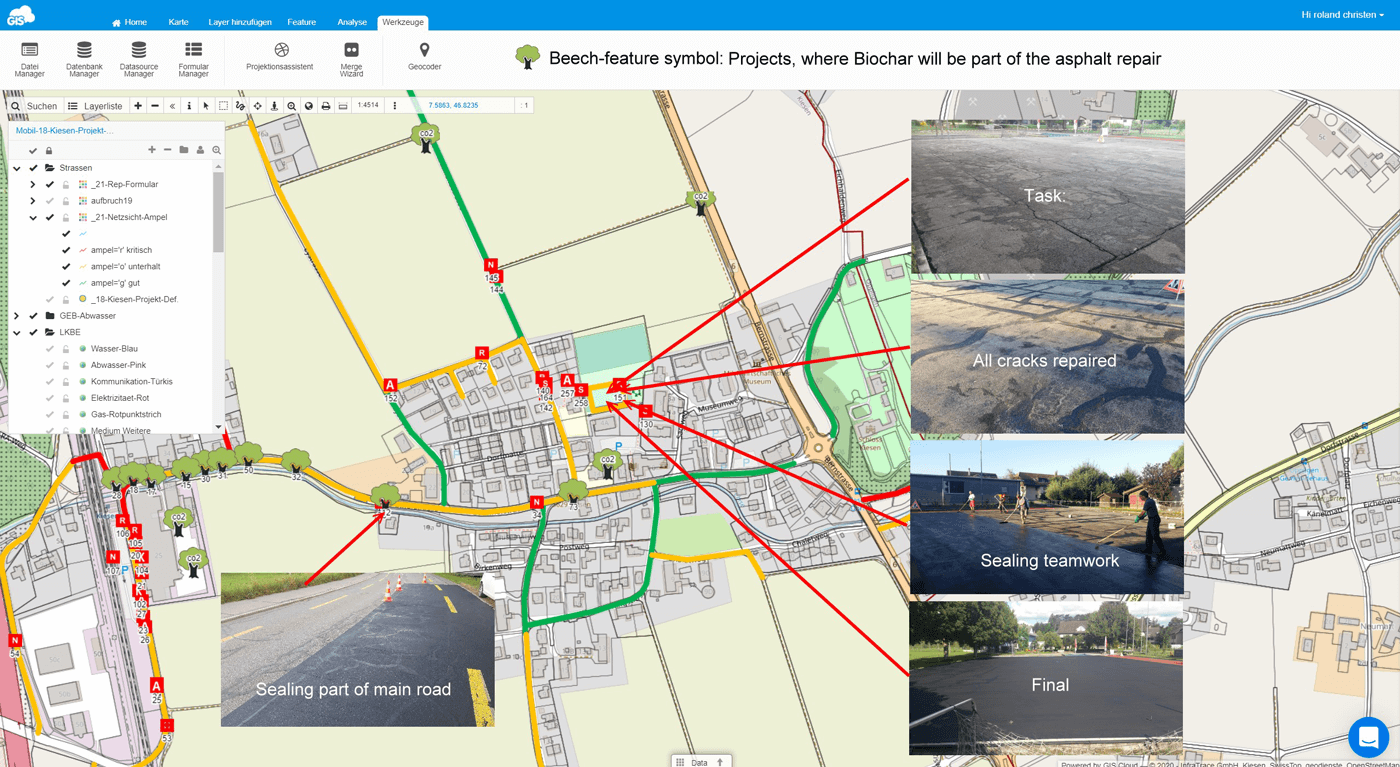
The Mobile Data Collection application allows the data to be instantly visible on the map in the cloud. This technology communicates the progress made throughout the day and over time as the inventory is collected.
The live data collection enables InfraTrace to estimate its completion timeline more confidently.
With an accurate, up-to-date, and thoroughly attributed inventory, the team is ready to begin the GIS Cloud and Power BI integration.
GIS and Power BI Integration
Before discovering the power of GIS and Power BI, Roland Christen of InfraTrace had previously used Microsoft Excel to catalog community infrastructure. Finding the ease with which GIS Cloud and Power BI integrate into one another, he quickly made the switch.
The accurate infrastructure inventory data is first exported from GIS Cloud as a CSV table.
From there, the team can program additional formulas in the table, such as their live-calculation tool.
The CSV table is then imported into Microsoft’s Power BI. Next, the team configures the necessary dashboard for their client’s needs.
Power BI has a free option; however, you will be required to upgrade your license to publish your data to an external site. This upgrade also allows you to embed the dashboards into an iframe of a website.
For a road maintenance inventory dashboard, the data is shown in a few different ways.
The InfraTrace dashboard includes a pie chart cut into slices highlighting the current condition of the roads in the area. Selecting a slice brings up that group’s total values, including road length, area, and projected maintenance costs for 10 years.
Other information is shown in tables, graphically symbolized to make it easy to understand. The dashboard includes widgets that can be used as counters.
The different dashboard features can be linked, allowing for a dynamic data viewing experience. Making a selection in one data widget automatically applies those filters to the others. This gives leaders the ability to interpret the information presented to them easily. In this video, you will find out how InfraTrace integrated Power BI with GIS Cloud to enhance the project data.
Community Empowerment
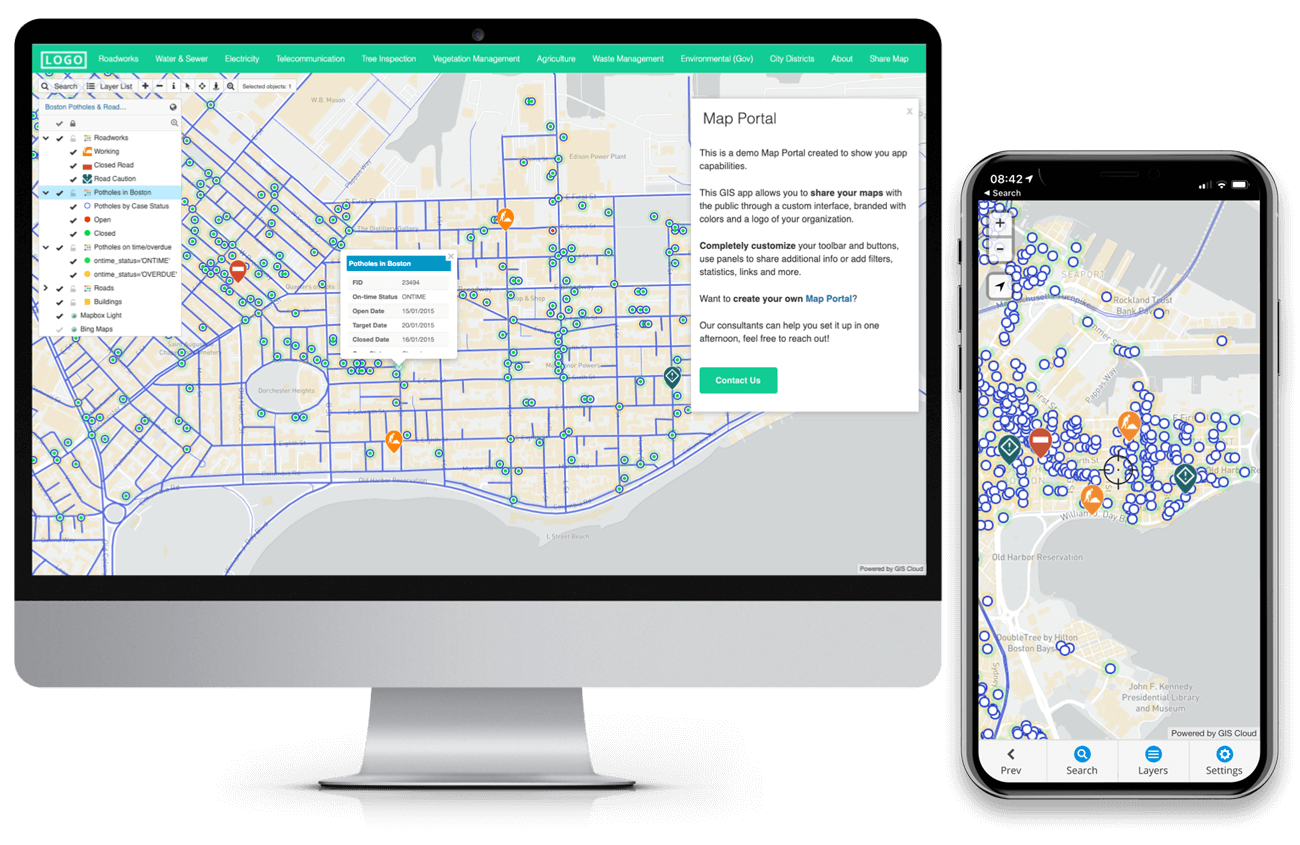
Information is most useful when shared with others. By presenting the information to the public, they can be informed about how and why their tax money is being spent.
The ability to embed dashboards into website iframes for sharing with clients and the public has been important.
The public sharing of information has encouraged the public to provide their input into decision-making. Decision-makers are able to use the dashboards to highlight the improvements they are achieving with their programs.
Next Steps
InfraTrace has been a client with GIS Cloud since 2017, and recently in 2022, it has become a GIS Cloud partner. GIS Cloud continues to develop tools and plugins that support organizations like Infratrace’s goals. This relationship is a two-way street, as each uses the other to grow and provide better client services.
InfraTrace has continued on its path of coordinating with communities on infrastructure management. They have developed workflows that encourage safe public facilities and provide information so tax money can be invested appropriately.
As always, if you think GIS Cloud and Power BI can take your organization to the next level, reach out to one of our Solution Consultants or sign up for a free trial.


