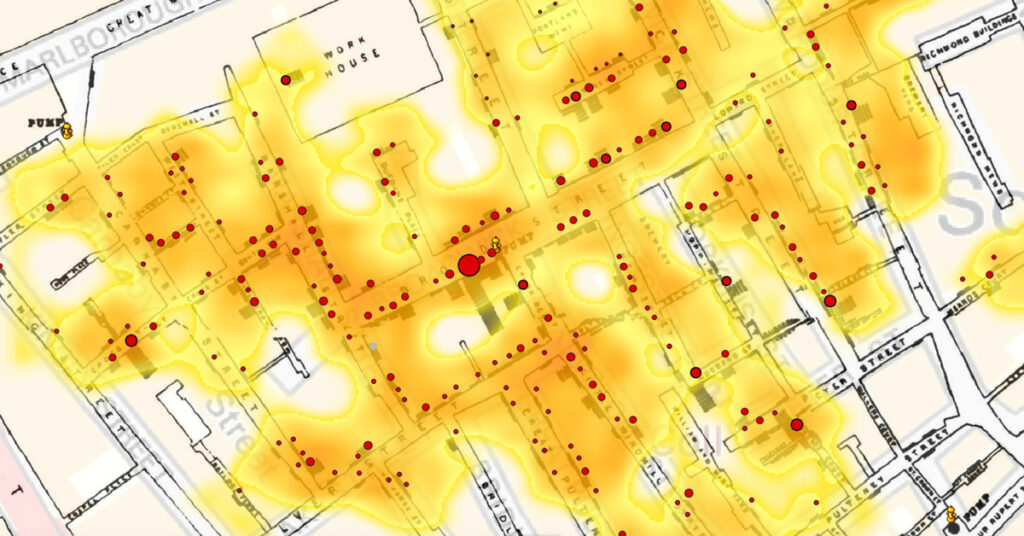
In the 19th century, a severe outbreak of cholera occurred in London in the area of Broad Street (now Broadwick Street). There were over 500 fatal attacks of cholera in 10 days within the 250 yards (0,2 kilometers) from the spot.
British doctor John Snow couldn’t convince other doctors and scientists that cholera, a deadly disease, was spread by drinking contaminated water.

He published an article in 1849 outlining his theory, but doctors and scientists thought he was on the wrong track and stuck with the popular belief of the time that cholera was caused by breathing atmospheric pollution vapors.
Dr. Snow gathered information from hospital and public records on when the outbreak began and whether the victims drank water from the Broad Street pump. Snow suspected that those who lived or worked near the pump were the most likely to use the pump and thus, contract cholera.
By using a geographical grid to chart deaths from the outbreak and investigating each case to determine access to the pump water, Snow developed what he considered positive proof the pump was the source of the epidemic.
He also investigated groups of people who didn’t get cholera and tracked down whether they drank pump water. That information was important because it helped Snow rule out other possible sources of the epidemic besides pump water.
Snow used a spot map to illustrate how cases of cholera were centered around the pump. His efforts to connect the incidence of cholera with potential geographic sources centered around creating what is now known as a Voronoi diagram. He mapped out the locations of individual water pumps and generated cells which represented all the points on his map which were closest to each pump. The section of Snow’s map representing areas in the city where the closest available source of water was the Broad Street pump circumscribed most cases of cholera.
After the cities finally improved water supply sanitation, the cholera epidemics in Europe and the United States in the 19th century ended… and GIS was born!


